
This is a monitoring feature included with Exchange that until recently, I did not know existed, as it wasn’t really mentioned in any of my dealings with Exchange Server up until recently. The HealthSets feature monitors every aspect of a running Exchange Server and is broken down into three monitoring components:
- Probe: used to determine if Exchange components are active.
- Monitor: when probes signal a different state then the one stored in the patters of the monitoring engine, monitoring engine will determine whether a component or feature is unhealthy.
- Responder: will take action if a monitor will alert the responder about an unhealthy state. Responders will take different actions depending on the type of component or feature. Actions can start with just recycling the application pool and can go to as far as restarting the server or even worse putting the server offline so it won’t accept any connections.
From what I have experienced in the past year with these HealthSets, an alert will be thrown due to a change in a service, or a restart of a service, a failed monitoring probe result, or something of the like. The healthset will become “unhealthy” in state at that time. You can run the following on a server in order to get the healthset status of that server:
1 | Get-HealthReport -Identity 'ServerName' | ? { $_.AlertValue -eq "UnHealthy"} | select HealthSet -Expand Entries | ?{$_.AlertValue -eq "Unhealthy"} | ft -a -wr |
If you get alerts for multiple Exchange Servers, let’s say for instance, the transport array, you can run the following cmdlets to get the status of all the Transport Servers in the array:
1 2 | $HTList = Get-TransportService | Sort-Object Name | Select-Object Name foreach ($HT in $HTList) { $HT; Get-HealthReport -Server $HT.Name | ?{$_.AlertValue -eq "Unhealthy"} | select HealthSet -Expand Entries | ?{$_.AlertValue -eq "Unhealthy"} | ft -a -wr } |

Now, a lot of times, the Unhealthy value in the HealthSet will have corrected itself as per the Responder, even though the AlertValue will remain Unhealthy. To clear the cache quickly and have the monitor probes run again for verification, perform the following restarts of services from this cmdlet in this order:
1 | Restart-Service MSExchangeHM;Restart-Service MSExchangeDiagnostics;Restart-Service MSExchangeMailboxAssistants |
That should clear the probe results and let them run again. Now, should they again return an error, we will need to dig deeper to figure out the issue.
What you will want to do first is get the monitor definition. In this example, the Mapi.Submit.Monitor was the component that was unhealthy in the healthset. I had to run the following cmdlet to get the Monitor Definition:
1 | (Get-WinEvent -LogName Microsoft-Exchange-ActiveMonitoring/MonitorDefinition | % {[XML]$_.toXml()}).event.userData.eventXml | ?{$_.Name -like "Mapi.Submit.Monitor"} |
Output:
auto-ns2 : http://schemas.microsoft.com/win/2004/08/events
xmlns : myNs
Id : 404
AssemblyPath : C:\Program Files\Microsoft\Exchange Server\V15\Bin\Microsoft.Office.Datacenter.ActiveMonitoringLocal.dll
TypeName : Microsoft.Office.Datacenter.ActiveMonitoring.OverallXFailuresMonitor
Name : Mapi.Submit.Monitor
WorkItemVersion : [null]
ServiceName : MailboxTransport
DeploymentId : 0
ExecutionLocation : [null]
CreatedTime : 2018-10-03T09:48:32.9036616Z
CreatedTime : 2018-10-03T09:48:32.9036616Z
Enabled : 1
TargetPartition : [null]
TargetGroup : [null]
TargetResource : MailboxTransport
TargetExtension : [null]
TargetVersion : [null]
RecurrenceIntervalSeconds : 0
TimeoutSeconds : 30
StartTime : 2018-10-03T09:48:32.9036616Z
UpdateTime : 2018-10-03T09:45:12.3073447Z
MaxRetryAttempts : 0
ExtensionAttributes : [null]
SampleMask : Mapi.Submit.Probe
MonitoringIntervalSeconds : 3600
MinimumErrorCount : 0
MonitoringThreshold : 8
SecondaryMonitoringThreshold : 0
MonitoringSamplesThreshold : 100
ServicePriority : 2
ServiceSeverity : 0
IsHaImpacting : 0
CreatedById : 57
InsufficientSamplesIntervalSeconds : 28800
StateAttribute1Mask : [null]
FailureCategoryMask : 0
ComponentName : ServiceComponents/MailboxTransport/High
StateTransitionsXml : <StateTransitions> <Transition ToState=”Unrecoverable” TimeoutInSeconds=”0″ /> </StateTransitions>
AllowCorrelationToMonitor : 0
ScenarioDescription : [null]
SourceScope : [null]
TargetScopes : [null]
HaScope : Server
Version : 65536
From the output, you look for the SampleMask. Getting the SampleMask will tell you the probe that is being used in the HealthSet query. From there, you can use that value to get the definition of the probe with the following cmdlets:
1 2 | $Probes = (Get-WinEvent -ComputerName "ServerName" -LogName Microsoft-Exchange-ActiveMonitoring/ProbeDefinition | % {[xml]$_.toXml()}).event.userData.eventXml $Probes | ? {$_.Name -eq "Mapi.Submit.Probe"} | fl |
OUTPUT:
auto-ns2 : http://schemas.microsoft.com/win/2004/08/events
xmlns : myNs
Id : 99
AssemblyPath : C:\Program Files\Microsoft\Exchange Server\V15\Bin\Microsoft.Forefront.Monitoring.ActiveMonitoring.Local.Components.dll
TypeName : Microsoft.Forefront.Monitoring.ActiveMonitoring.Transport.Probes.MapiSubmitLAMProbe
Name : Mapi.Submit.Probe
WorkItemVersion : [null]
ServiceName : MailboxTransport
DeploymentId : 0
ExecutionLocation : [null]
CreatedTime : 2019-01-05T03:22:02.4029588Z
Enabled : 1
TargetPartition : [null]
TargetGroup : [null]
TargetResource : [null]
TargetExtension : [null]
TargetVersion : [null]
RecurrenceIntervalSeconds : 300
TimeoutSeconds : 30
StartTime : 2019-01-05T03:23:36.4029588Z
UpdateTime : 2019-01-05T03:17:17.2695414Z
MaxRetryAttempts : 2
ExtensionAttributes :
CreatedById : 57
Account :
AccountDisplayName :
Endpoint :
SecondaryAccount :
SecondaryAccountDisplayName :
SecondaryEndpoint :
ExtensionEndpoints : [null]
Version : 65536
ExecutionType : 0
From there you can view and verify the associated error messages that the probe generated when it was run. According to the previous data output, the probe runs every 300 seconds. You will want to filter your logs based on criteria that you input into the cmdlet when searching the log for the events. Properties include:
- ServiceName – Identifies the HealthSet used.
- ResultName – Identifies the probe name. When there are multiple probes for a monitor the name will include the sample mask and the resource that you are verifying.
- Error – Lists the error returned during the failure.
- ResultType – Lists the value for the result type: 1 = timeout, 2 = poisoned, 3 = success, 4 = failed, 5 = quarantined, 6 = rejected.
So, based on that information, run the following cmdlet to get the last errors in the event log based on the ResultName (Mapi.Submit.Probe) and ResultType (failure). Since there could be a lot of returned data, I tell the cmdlet to select the first 2 results in the output:
1 2 | $errRecords = (Get-WinEvent -ComputerName "ServerName" -LogName Microsoft-Exchange-ActiveMonitoring/ProbeResult -FilterXPath "*[UserData[EventXML[ResultName='Mapi.Submit.Probe'][ResultType='4']]]" | % {[XML]$_.toXml()}).event.userData.eventXml $errRecords | Select-Object -first 2 -Property *time,result*,error*,*context |
SAMPLE OUTPUT:
ExecutionStartTime : 2018-10-12T04:42:26.4725482Z
ExecutionEndTime : 2018-10-12T04:42:26.5037975Z
ResultId : 350715748
ResultName : Mapi.Submit.Probe
ResultType : 4
Error : MapiSubmitLAMProbe finished with CheckPreviousMail failure.
ExecutionContext : MapiSubmitLAMProbe started. This performs – 1. Submits a new message to Store 2. Checks results from previous Send Mail operation. Sequence # = 636741569280603580. First Run? = False. Previous mail submission to store was successful. Results – # of previous results: 0. Could Not Find stages that ran. Previous SendMail failure – Mail submitted to Store during the previous run never reached SendAsCheck. This may indicate a latency from Store to Submission Service. Investigating. Found lower SA latency. Indicates an issue in Submission service. Investigate. In SendMail – NotificationID=00000063-0000-0000-0000-00006ab1f5bc Sending mail. SendMail finished. MapiSubmitLAMProbe finished with CheckPreviousMail failure.
FailureContext : MapiSubmitLAMProbe finished with CheckPreviousMail failure.
Once we have the error, we can begin to investigate what the Responder did to automatically remediate the issue using the following cmdlet:
1 | (Get-WinEvent -ComputerName "ServerName" -LogName Microsoft-Exchange-ActiveMonitoring/ResponderDefinition | % {[xml]$_.toXml()}).event.userData.eventXml | ? {$_.AlertMask -like "*Mapi.Submit.Probe*"} | fl Name,AlertMask,EscalationSubject,EscalationMessage,UpdateTime |
Now, in this example, I did NOT get any output due to the fact that I am running the query on a server that did NOT have any localized events that had a recent day. The last time this event occurred based on my notes was September 18th, 2018. But based on the screenshot from my research, you should get some similar output to the output in the below picture:
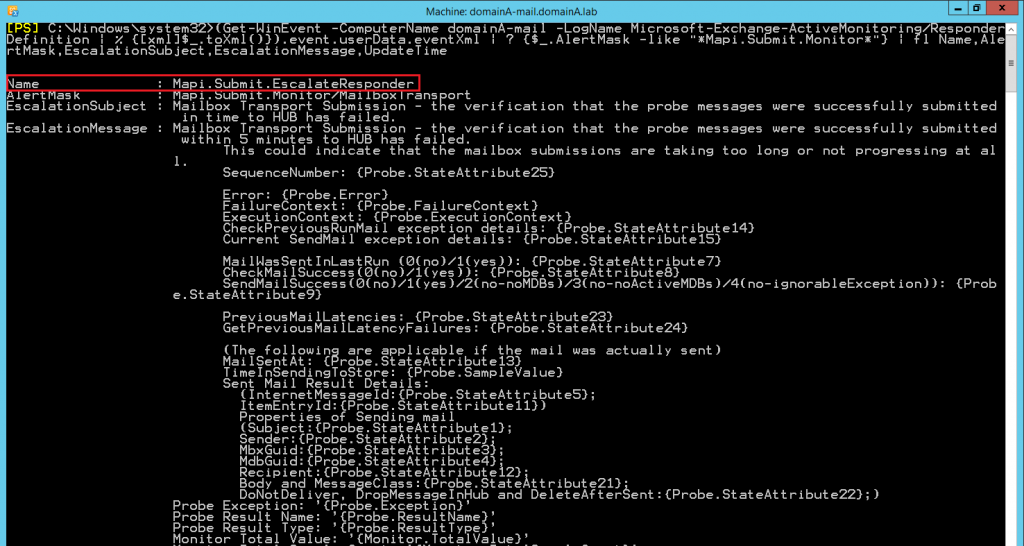
The responder we were looking for is Mapi.Submit.EscalateResponder as suggested by the screenshot above. This type of responder (Escalate) doesn’t make Managed Availability undertake any automatic repairs but is responsible for log notifications in event logs. After getting the correct responder, you would continue to troubleshoot and attempt to remediate the issue(s) that are behind the HealthSet failure.
In my example case, I found that the Health Mailbox used for the probe test was corrupted and had to be rebuilt. Once that mailbox was functional, the probe test ran successfully.
I hope that this will help you in troubleshooting any alerts in your Exchange environment that are HealthSet based. I know for sure that gathering this information has helped me get a grasp on how the Monitoring works and how it can be used to remediate issues.
A big “Thank You” to the following sites that helped provide most of the information that you see posted here:
Exchange 2013 Managed Availability HealthSet Troubleshooting
Managed availability in Exchange 2013/2016